project-group3-dataviz-story
Project 3 Group 3 Data Visualization
Table of Contents
- Introduction
- Project Brief
- Languages and Tools
- Project Flow
- Data Insight
- Conclusion
- Collaborators
- Data Sources
Introduction:
Addressing global poverty requires a comprehensive approach, as it stands among the foremost challenges of our time. Individuals in the most impoverished corners of the world often grapple with the absence of fundamental necessities like food, clean water, and education. A nuanced comprehension of poverty’s intricate trends and patterns is essential for formulating effective solutions to this pressing issue.
This repository contains researced data, visualizations, and other documentations related to EDA of global poverty. Breakdown of the project includes project structure, workflow, data analysis and resources to provide insights on collaboration work and result of the project. The objective is to furnish valuable data to guide future project management, illustrating how this data can serve as a pivotal tool in devising impactful solutions for combating the issue of poverty..
🖥 Project Brief
Our project aims to conduct a comparative data analysis of global poverty focusing on the differences within individual countries and their relationship between poverty, education and corruption factors. The primary objective is to unravel the complex interplay of these elements through data visualisation to inform targeted interventions and policies aimed at poverty alleviation.
🧰 Languages and Tools
In this project we outline the tools, language and libraries required to complete the project brief.
![]()
![]()
![]()
![]()
![]()
![]()
![]()
![]()
![]()
📊 HighChart JS Library
The official npm package contains Highcharts, including the Stock, Maps and Gantt packages, plus all modules. Start by installing Highcharts as a node module and save it as a dependency in your package.json:
npm install highcharts --save
Include the JavaScript files in the head section of the webpage as shown below:
<script src="https://code.highcharts.com/highcharts.js"></script>
🔃 Project Flow
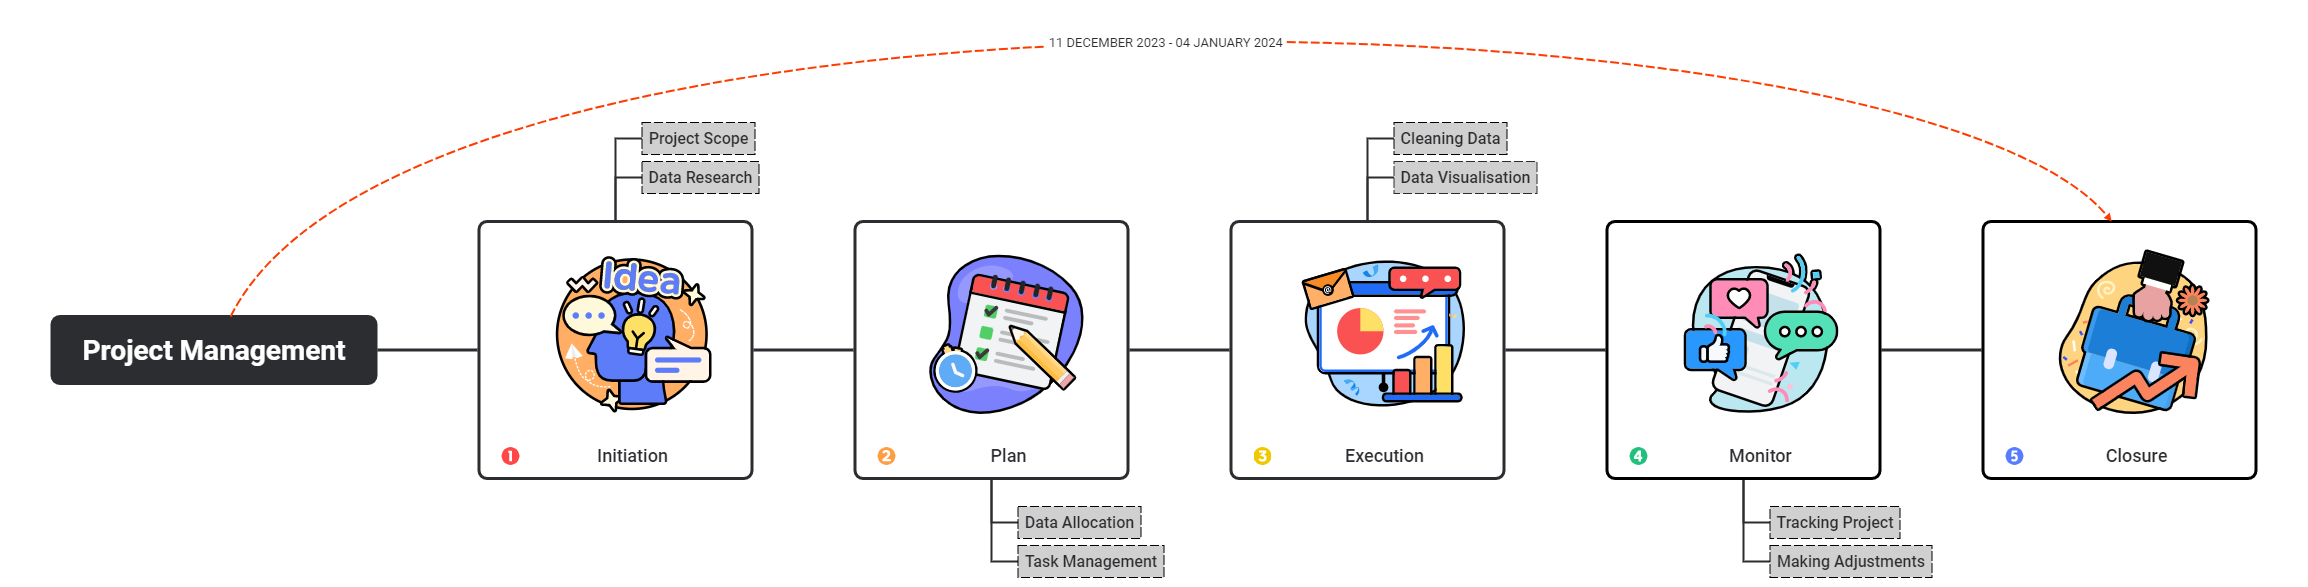 Project Initiation: 11 - December - 2023
Project Completion: 02 - January - 2024
💡 Data Insights
In an objective approach to compiling and generating a report, we employed specific measurements to aid in discerning the correlation between poverty, corruption, and education across different countries.
The research and data analysis exclusively utilized the dataset from the year 2020, primarily due to constraints related to the available data. This choice was particularly relevant as the study period coincided with the outbreak of a global pandemic, a transformative event that significantly reshaped the dynamics of the world during that timeframe.
1 - GLOBAL CORRUPTION INDEX
-
The Global Corruption Index (GCI), specifically the Corruption Perceptions Index (CPI) by Transparency International, is an annual assessment that ranks countries based on the perceived level of corruption in their public sectors. GCI covers 196 countries and territories and measures the state of corruption and white collar crimes around the world.
, International Poverty Line (IPL), and Gender Gap in Education Enrollment—reveals interconnected dynamics that shape the socio-economic landscape. This index highlights the alarming association between emergencies and corruption, emphasizing the need for transparency and effective governance during crises to prevent the exacerbation of societal challenges. Moreover, the International Poverty Line, recently shifted to $2.15 per day, establishes a monetary threshold for extreme poverty. This underscores the ongoing struggle for individuals living below this line, emphasizing the importance of addressing poverty as a multifaceted challenge requiring comprehensive solutions. Finally, the Gender Gap in Education Enrollment sheds light on the intricate connection between education, corruption, and societal power imbalances. The disparity in educational opportunities, particularly in countries with higher corruption levels, not only perpetuates gender inequalities but also contributes to the perpetuation of corrupt practices. In essence, the examination of these three measurements collectively underscores the need for holistic and interconnected approaches in tackling global poverty. Addressing corruption, understanding poverty thresholds, and promoting gender-inclusive education are integral components in fostering sustainable development and mitigating the complex challenges that perpetuate poverty on a global scale. ## 👨💼💻👩💼 Collaborators |